The human microbiome, which has been referred to as our second genome, consists of the microorganisms that live in and on our bodies [1]. They interact with the immune system, influence metabolic activities, and consequently also affect disease state [2]. Although the human microbiome is crucial for human health, it has largely been ignored. However, it has recently gained attention as a promising component of clinical diagnostics, as the substantial progress of next-generation DNA sequencing technologies has made it possible to capture a snapshot of microbial communities from human samples [1, 3].
Contribution Objectives
Previous studies have proposed disease-predictive models based on high-resolution microbial features, but as they only tested SVM, RF, Lasso, and elastic net (ENet) classification methods, the application of machine learning models is still lacking elaboration [4]. While focusing primarily on the additional application of neural network machine learning methods, we hoped to explore the following questions:
What data analytic techniques are suitable for human microbiome profile-based disease prediction?
Can a neural network model surpass existing methods?
What real-world insights can be learned from this project?
Data and Methodology
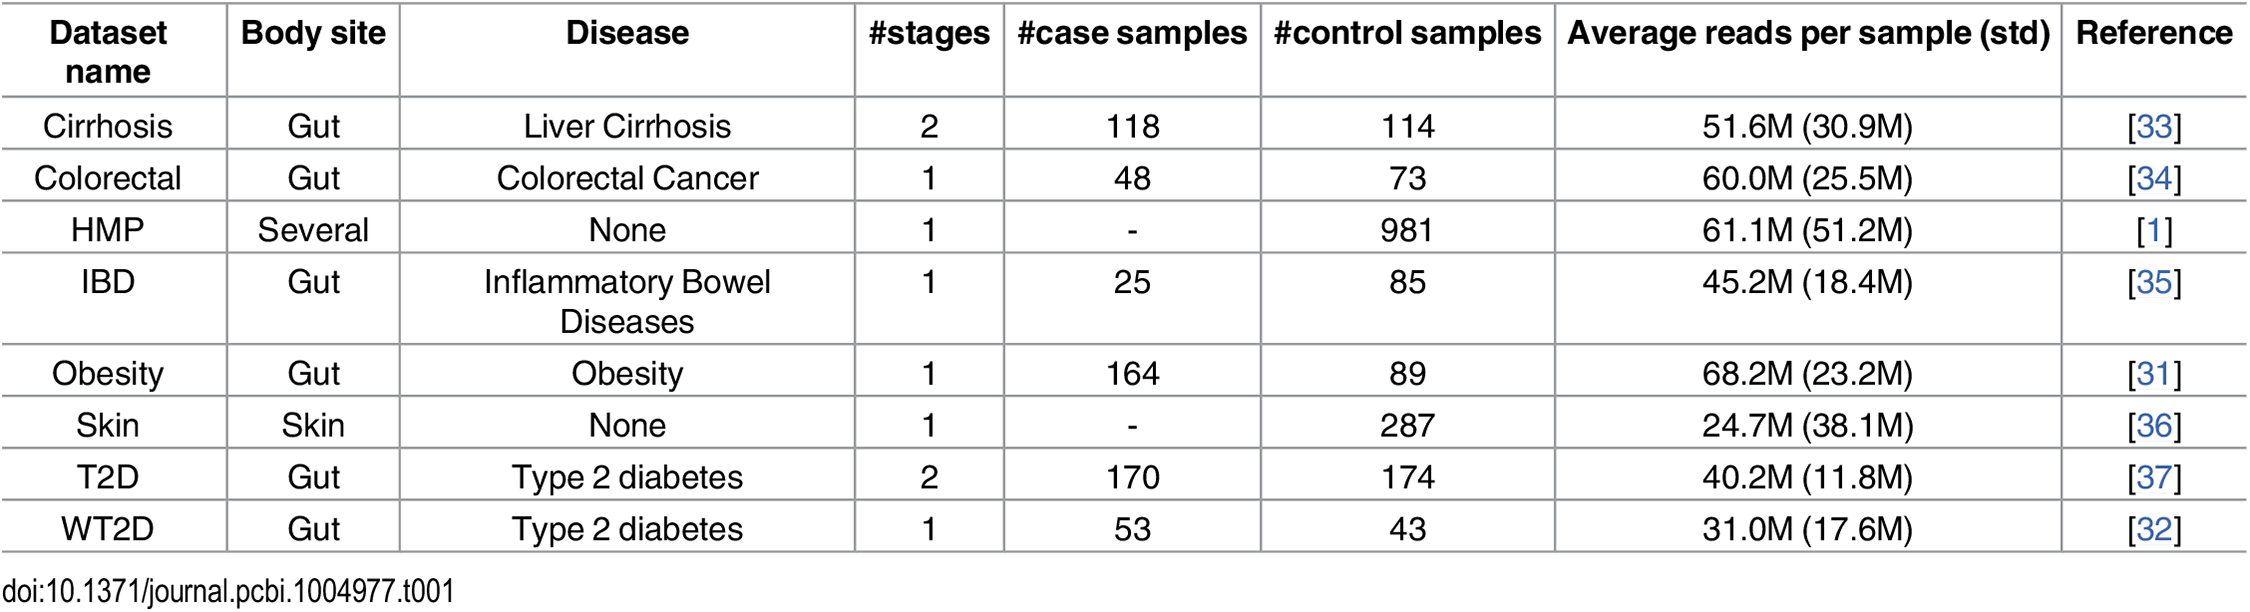
We built off the same datasets used in the study([4]), which were extracted using the open-source tool MetAML and are accessible from a public database. In addition, we explored their methodology to ensure our methodology and results could be comparable to those of the study through replicating the datasets [Table 1], and running preliminary tests.
Table 1: The number of samples per dataset. [4] The T2D data was collected from Chinese women while the WT2D data was collected from European women.
The data was initially already separated by species abundance and strain-specific markers data, but included many more samples than was used in the study. In process of duplicating the datasets, we found that samples with certain disease fields were excluded from the study, presumably in order to reduce the ambiguity of the data. The reasoning behind some exclusions were obvious, such as samples with the disease state of " -" and the "n" disease state for the obesity dataset, where the foil of "obesity" was "leanness." The removal of "impaired glucose tolerance" samples in the WT2D dataset likely served to make the data binary- not only for the aforementioned purpose of reducing ambiguity, but also in order to match the binary nature of the T2D dataset. On the other hand, the reason for the removal of the "large adenoma" samples while keeping "small adenoma" in the colorectal cancer dataset is not as easily induced, but could be related to its small sample size.
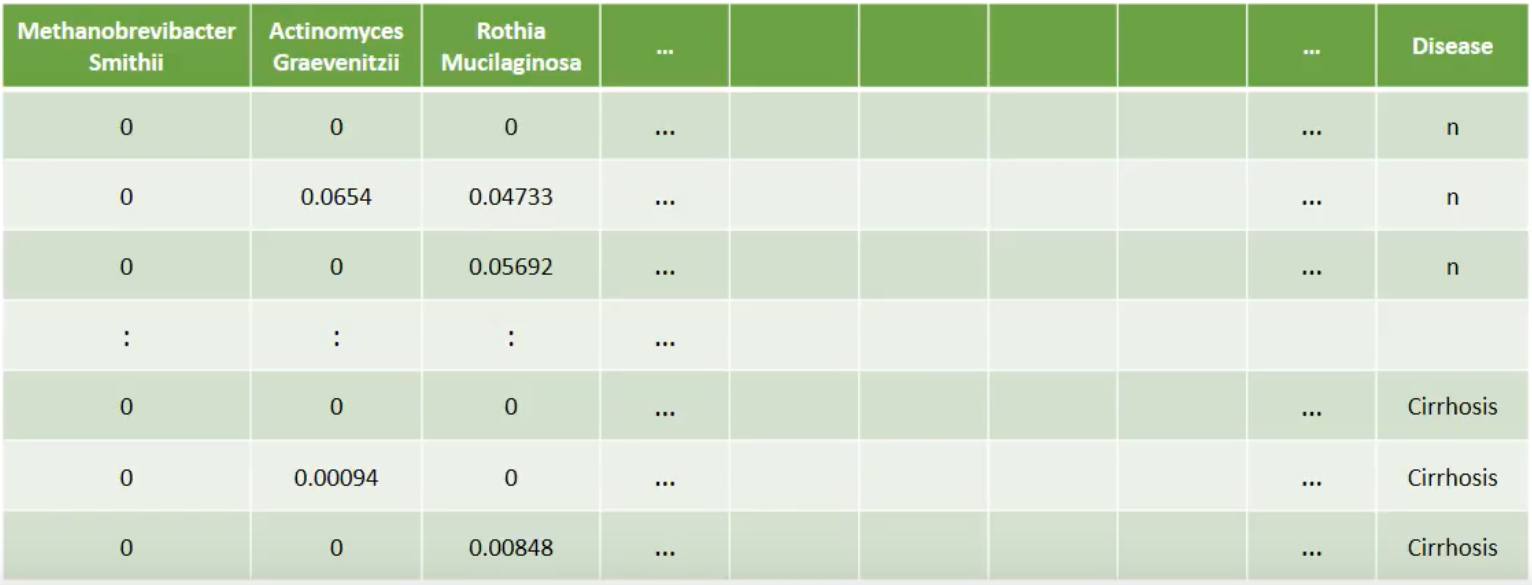
Example of processed data
The Random Forest(RF) and Multi-layer Perceptron(MLP), as well as Support Vector Machine(SVP) algorithms were built with the following parameters: Random Forest used 100 trees with the number of randomly chosen attributes calculated as integer(log2(# of features) + 1); Multi-layer Perceptron had a learning rate of 0.3, momentum of 0.2, a total of three layers(including input and output), number of units in the hidden layer calculated as integer((# of features + # of classes)/2), and 500 epochs; and Support Vector Machine had cost set to 1.0, epsilon in the loss function set to 0.1, and used the Radial Basis Function for the kernel. The results were also validated using ten-fold cross-validation for each test, and we chose the key performance metric as area under the curve(AUC), which is the value in Table 2 and Table 3.
Results
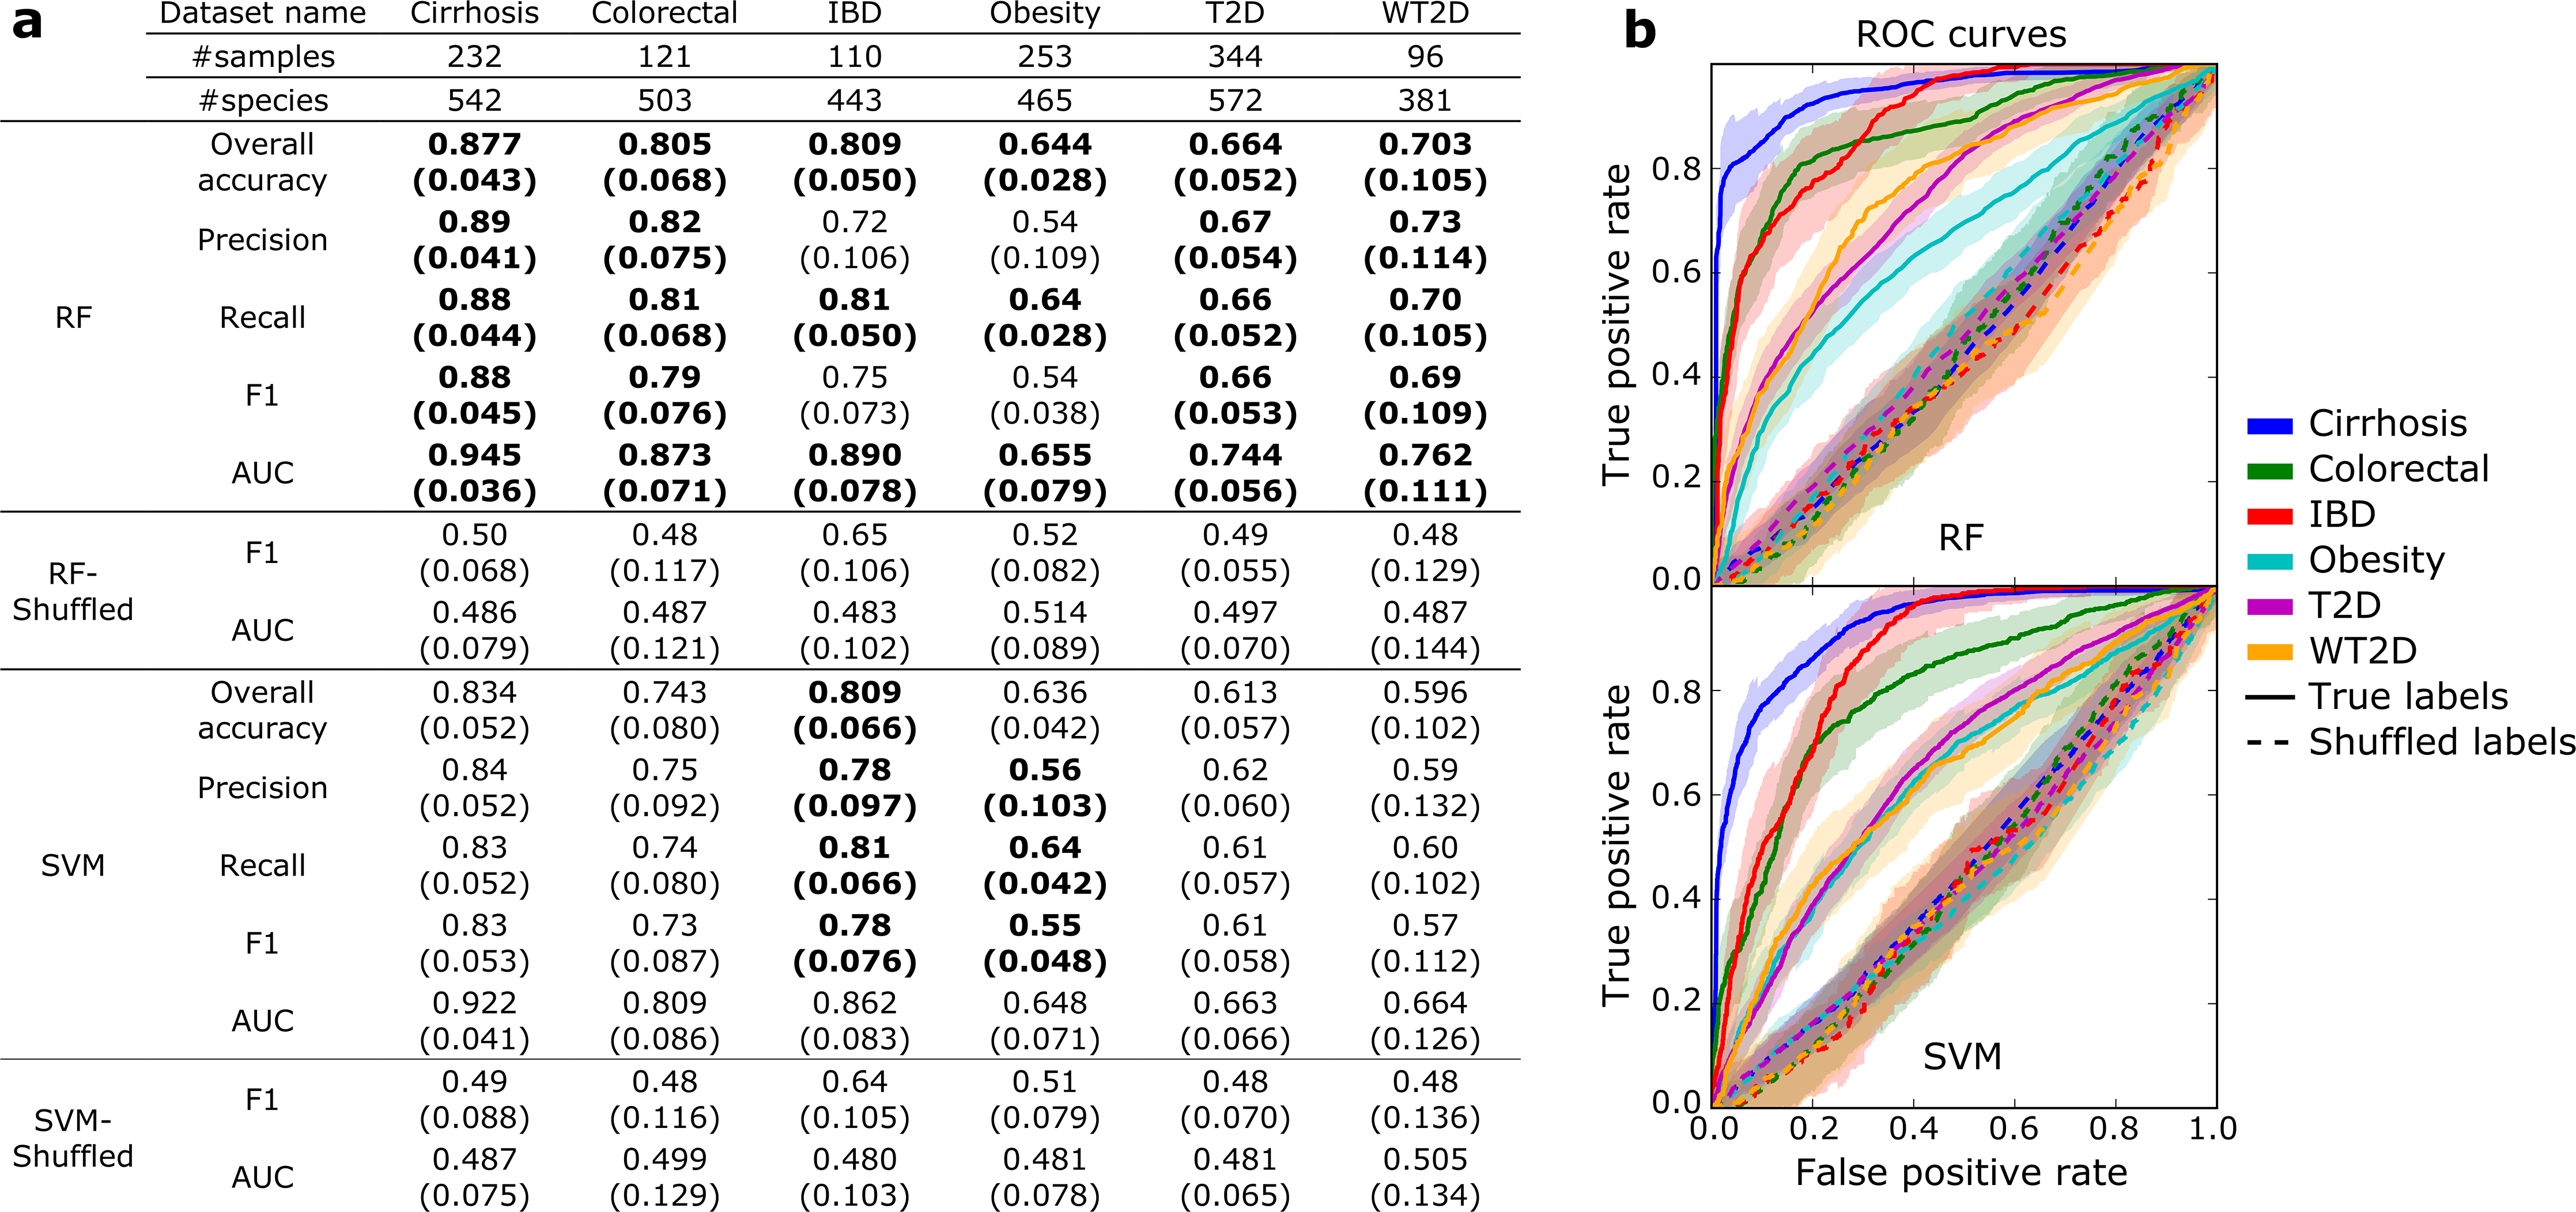
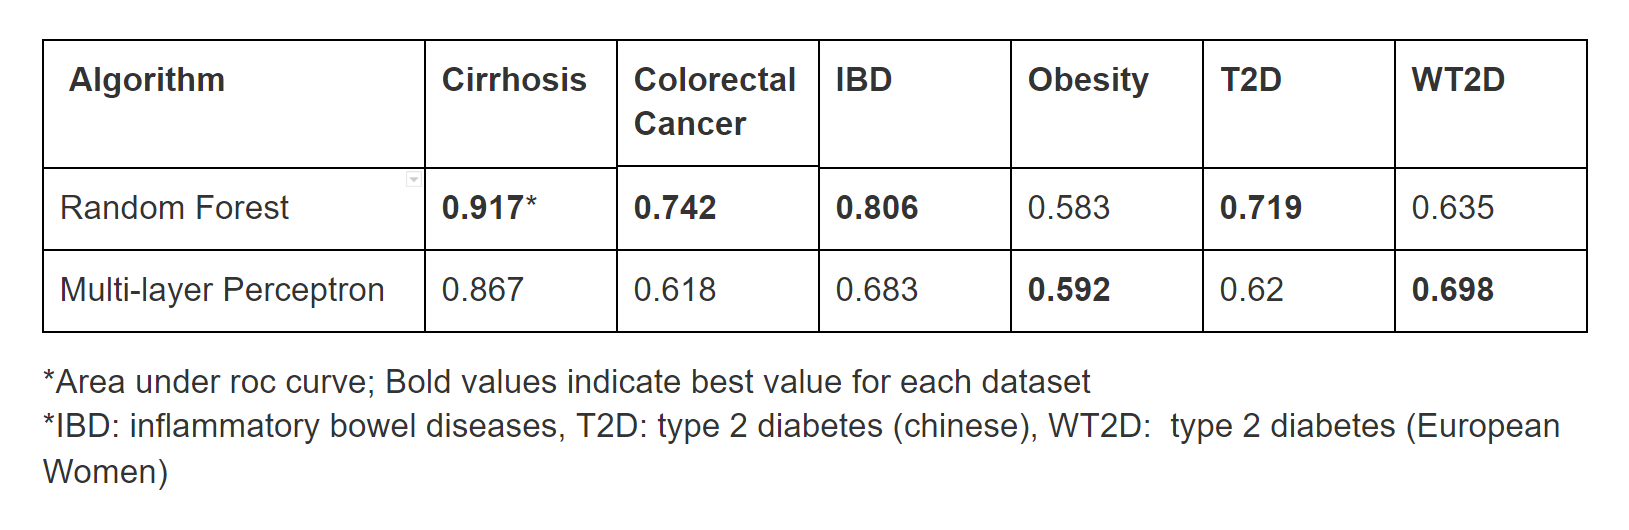
We built classification models based on the species abundance profile for each disease data set using Random Forest and Multi-layer Perceptron algorithms implemented in Weka. The data sets were split into training and test sets with ratios of 66.6 percent and 33.3 percent, respectively. We compared the classification performance of Random Forest, one of the most successful algorithms in the previous paper [Figure 1], with that of the Multi-layer Perceptron [Table 2]. In four cases, Random Forest shows better performance. However, it did not surpass the Multi-layer Perceptron in all cases. Specifically, Neural Networks showed better performance for predicting obesity and type 2 diabetes (European cohort).
Figure 1: Cross-validated results from previous study [4]Table 2: Cross-validated preliminary results comparing the prediction performance Random Forest(RF) and Multi-layer Perceptron algorithms
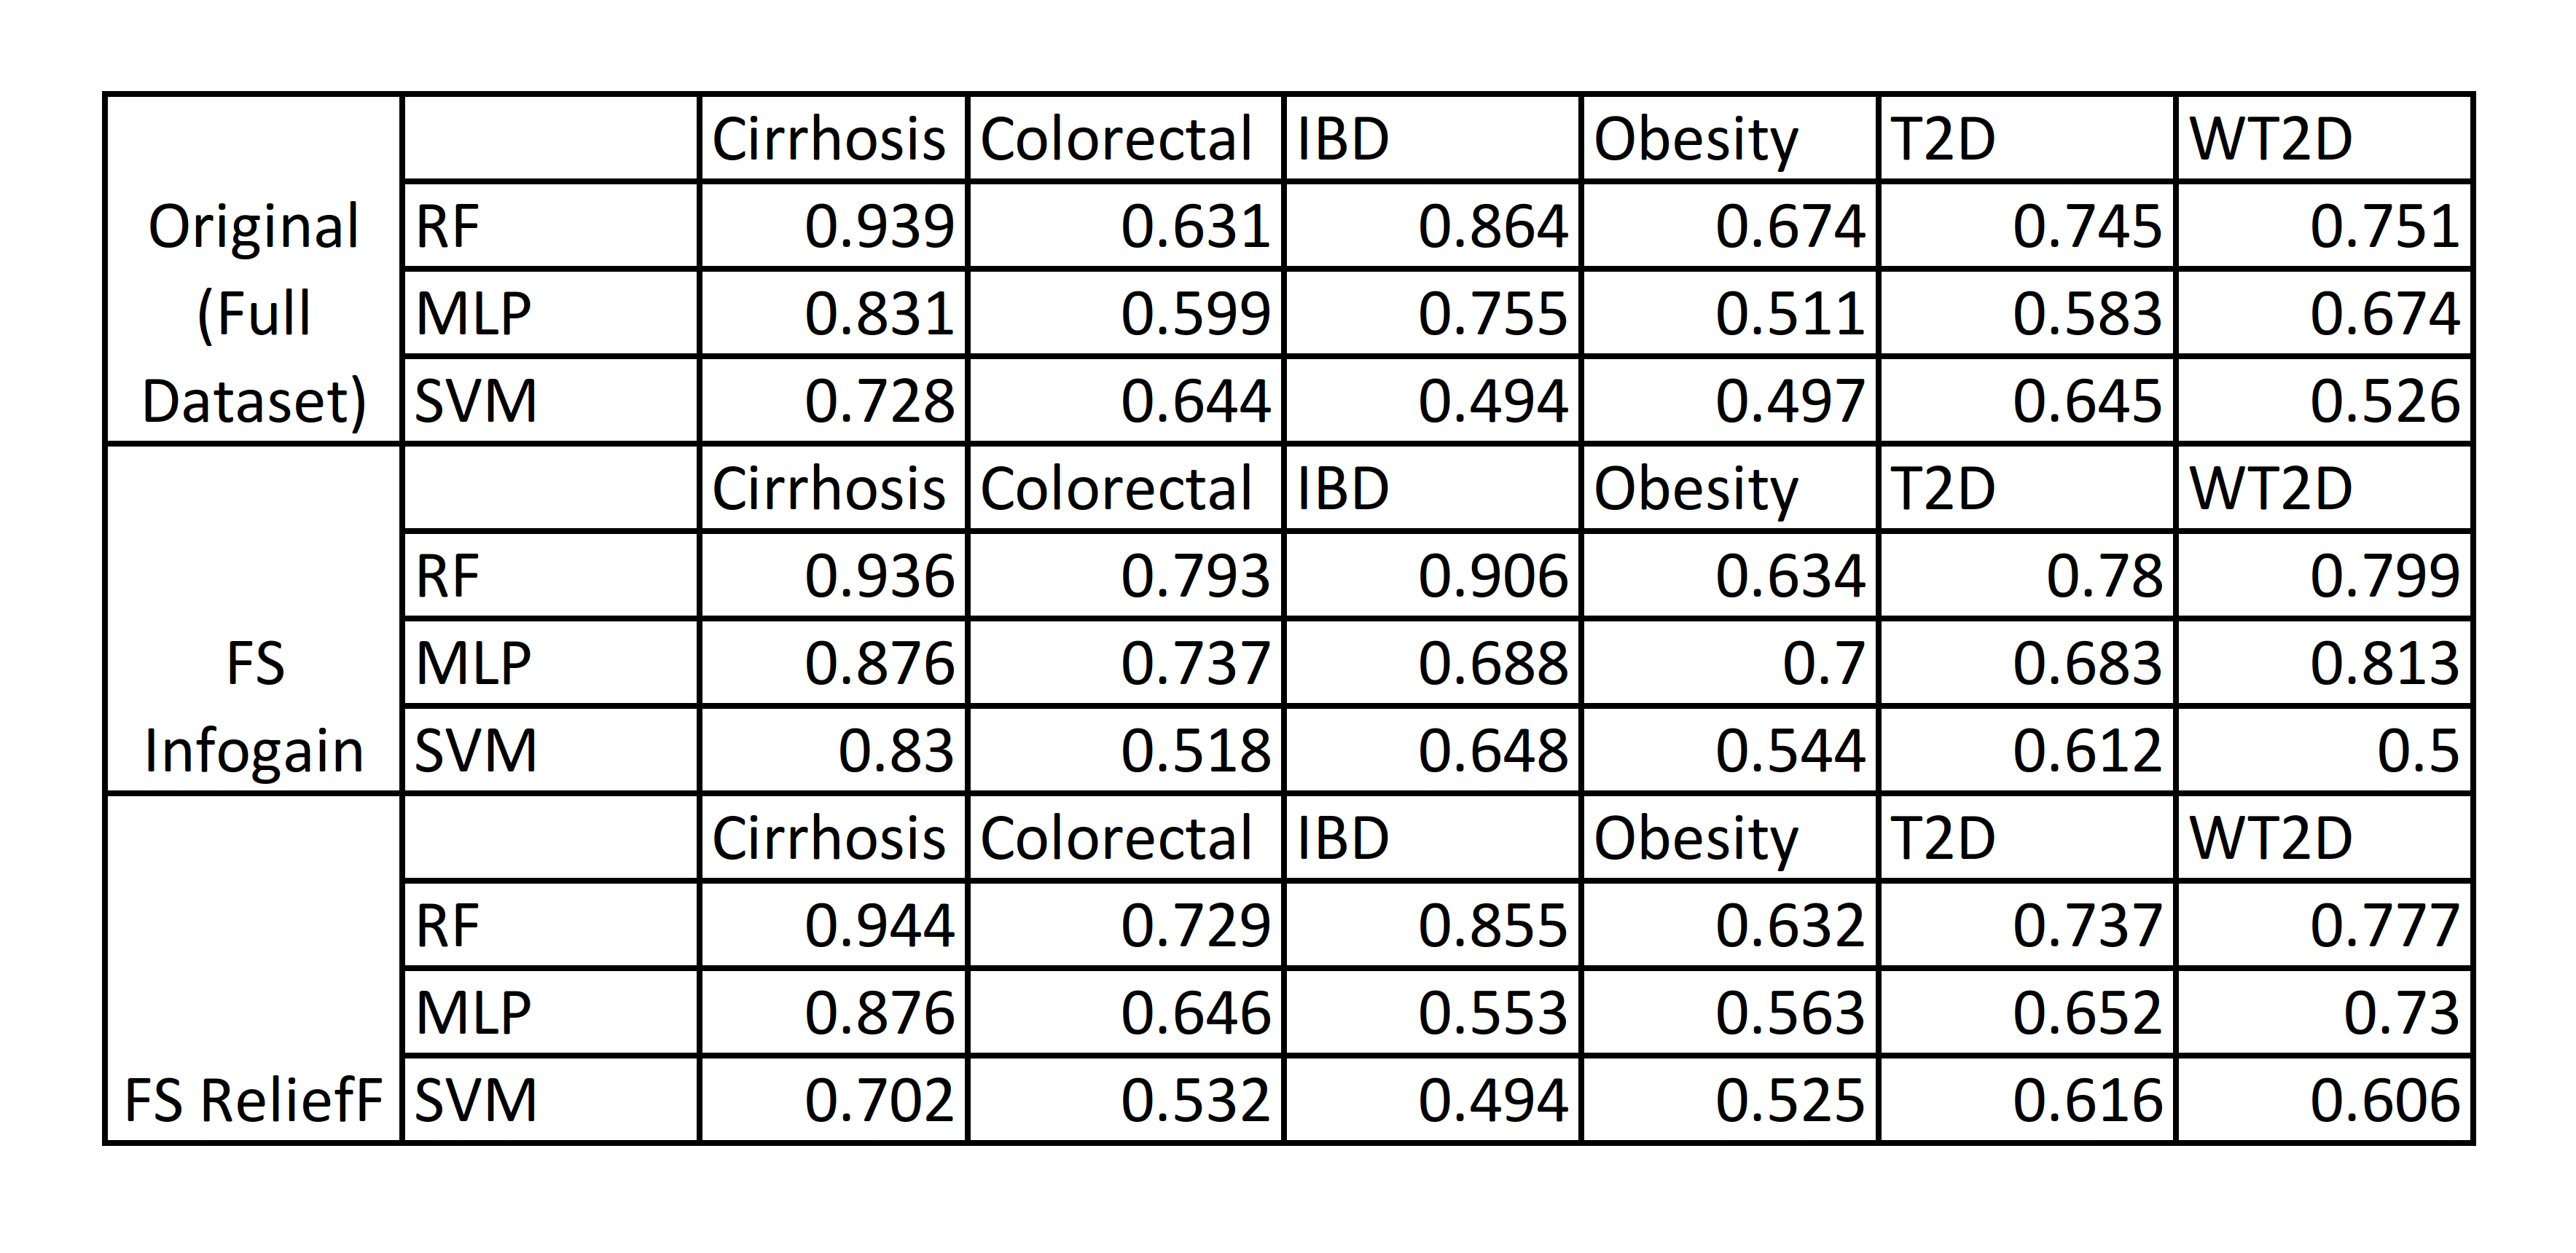
Performing feature selection (FS) on the datasets could improve prediction performance, so we chose to use the Information Gain (Infogain) and the Relief feature selection algorithms to refine the dataset by identifying the most significant/valuable features and removing the rest. For these tests, we also included Support Vector Machines(SVM), another major point of comparison in the study[4], in addition to Random Forest(RF) and Multi-layer Perceptron(MLP) for comparison.
Table 3: Performance of RF, ML Perceptron, and SVM on datasets after Feature Selection.
Applying Infogain improved the performance of the ML Perceptron enough to exceed the performance of SVM for the Colorectal Cancer and T2D datasets, when compared to the original datasets[Table 3]. Though its performance rarely outstripped RF in most cases, MLP improved significantly enough after infogain feature selection to outperform RF for the obesity dataset by a considerable margin. Overall, RF still consistently performed better than either MLP or SVM for Liver Cirrhosis, Colorectal Cancer, Inflammatory Bowel Disease, and Type 2 Diabetes in the Chinese cohort, while MLP was able to gain an advantage over RF in predicting Obesity and Type 2 Diabetes in European women.
Analysis and Discussion
Applying feature selection improved performance for almost all datasets, with the exception of Inflammatory Bowel Disease(IBD), where feature selection actually resulted in decreased accuracy on for MLP.
Future Work
As the time frame limited the scope of this project, there are several areas of future expansion: exploration of more hyperparameter optimization methods with cross-validation schemes, trying other Neural Network algorithms, and incorporating strain-specific marker data.
References
Grice, Elizabeth A., and Julia A. Segre. "The human microbiome: our second genome." Annual review of genomics and human genetics 13 (2012): 151-170.
Honda, Kenya, and Dan R. Littman. "The microbiota in adaptive immune homeostasis and disease." Nature 535.7610 (2016): 75-84.
Hardwick, Simon A., Ira W. Deveson, and Tim R. Mercer. "Reference standards for next-generation sequencing." Nature Reviews Genetics 18.8 (2017): 473-484.